


July 2022: COVID in NYC Wastewater
Why July may have been the peak of the current surge

Welcome to the Deep

Thanks for checking out my first data dispatch from NYC's sewers (in spirit if not physically). We’re talking about COVID and wastewater, and while a future post will break this down in more detail, here’s some basics:
As antigen testing for COVID-19 decreases, getting an accurate picture of the pandemic situation becomes harder if you only look at the number of positive cases (Why’s that? Well for starters, this metric depends on the number of people tested for COVID, which has fallen by more than half in the past 3 months)
However, NYC has been doing excellent tracking for concentrations of COVID-19 virus passing through wastewater treatment centers. This can be a more reliable indicator of the pandemic situation, since it doesn’t depend on factors like number of people testing (NYC is also using wastewater to detect monkeypox and polio in the city).
Unfortunately, while this raw COVID wastewater data is being shared monthly by the city, there’s no great resource to summarize and visualize it. That’s what this newsletter hopes to be.
Every month, NYC reports the last ~30 days data of COVID concentrations in wastewater. Since it’s ~2 weeks out of date by the time it’s released, these metrics can’t give us a perfect picture of the “situation on the ground today.” Instead, we’ll frame it as “what went down in the sewers last month” and see what we can learn about the COVID situation in the city as of the end of July 2022 (and every month moving forward).1
My hope is that citizens who are interested in the current state of the pandemic in New York City can use this as a resource to analyze trends. That can hopefully give an additional data point to understand how the virus is affecting our city, and maybe even make decisions about our safety and comfort levels.
At the same time, I’m neither an epidemiologist, public health expert, nor statistician — so please simply accept these as one interested citizen’s attempts to make the best sense he can of the data that’s out there.
(As a side note, I’m working on another post about my methodology, but if any experts are reading and have questions or suggestions please drop me a line!)
Alright, let’s see some metrics.
What went down in the sewers last month (July 2022)
Data are currently reported through 7/31/22 by the City of New York.
Average COVID Concentrations in NYC Wastewater
About this metric
The estimated COVID concentration answers the question “How much virus is in the city right now?”
NYC samples and reports the concentration on COVID seen in wastewater from 14 different treatment plants throughout the city. To turn this into a single metric, we average all the samples and weight by the population that each treatment plant serves. While this is imperfect (e.g. the amount of folks’ waste processed by a plant could vary based on tourism and other factors), it gives us a reasonable estimate of the average COVID concentration per capita in the city.
A 7-day rolling average is also visualized (in purple) to make it easier to see trends.
Special thanks to Vika & Adotchka from the Friendly Ambitious Nerds Discord for their feedback and advice on this metric.
“Reported cases” are also included (in blue) in the visualization as a reference (since it’s the most recognizable marker of the pandemic for most New Yorkers), but this analysis isn’t intending to imply a specific relationship between wastewater measurements and cases (the graph is just scaled proportionately so it’s a bit of an optical illusion).

Analysis & Perspective
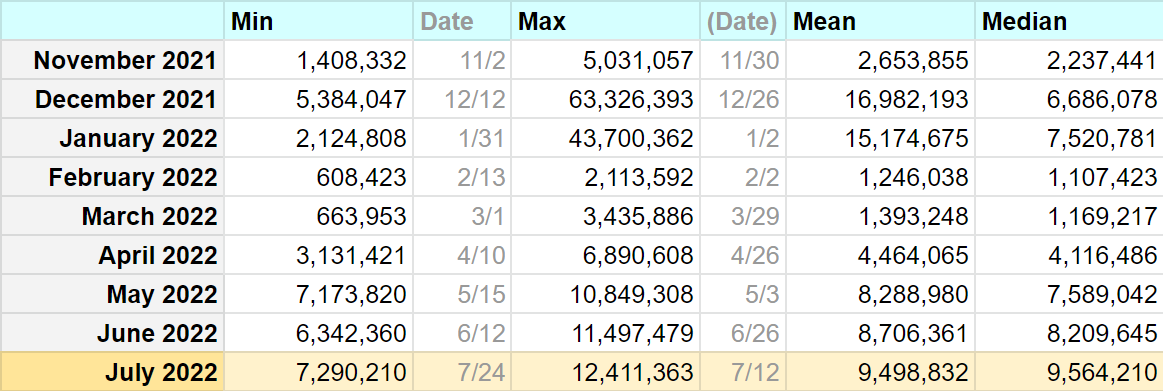
TL;DR: July’s concentrations showed that the surge which started in April/May continued its relatively high plateau.
The mean viral load in July 2022 was ~9.49 million copies/day. This is slightly higher than the mean viral load in both May and June (8.29 million and 8.71 million).
All additional metrics also don’t show the viral load falling in July: the minimum, maximum, and median wastewater measures during July 2022 are all slightly higher than both May and June. Viral load got high in April, and stayed high ever since.
To compare to past periods:
Omicron Surge (Jan 2022): July’s viral load is much lower than during the original Omicron surge, which peaked at a maximum of 63.3 million copies/day. Fortunately, COVID is not as prevalent as we saw then.
Second Wave (Winter 2020/2021): The load is more comparable to NYC’s “Second wave” in Winter 2021, which peaked at 13.14 million copies/day, and also had measurements that never fell below a minimum of 6.61 million copies/day throughout all of January & February.
Correction: This was originally listed as “Winter 2021/2022.” The dates have been corrected.
Delta Wave (Summer 2021): The values are also similar to the height of the Delta wave in Summer 2021, which peaked at 10.18 million copies/day, although it fell relatively quickly from that peak.
COVID Wastewater Trends (Percent Daily Change)
About this metric
This metric answers the question “Over the past week and a half, did measured wastewater concentrations get better or worse?”
The is based on the CDC guidance on how to analyze wastewater trends. For every day that there’s a new wastewater sample reported, we compute a Percent Daily Change (PDC) based on the past 10 days of samples (i.e. how much the wastewater levels have changed daily, on average, over the past 10 days).
Here, positive numbers are bad (situation getting worse) and negative numbers are good (rates are falling). The magnitude of the number indicates how quickly things are changing (i.e. how fast are things getting worse or better).
Values are colored red when they are positive (virus getting worse) and green when they are negative (virus getting better). I chose +5% and -5% as reasonable thresholds to show when things are getting much worse (brighter red) or much better (brighter green).
Note that bright red doesn’t necessarily indicate a dire situation — when there are very low rates of COVID, having a large increase may not translate to a huge shift in the situation on the ground. However, when there are sustained periods that stay positive or negative, it’s a good indication that the situation is not stable, but actively changing.
Correction: The graph below should have a date o f”7/31/22.”

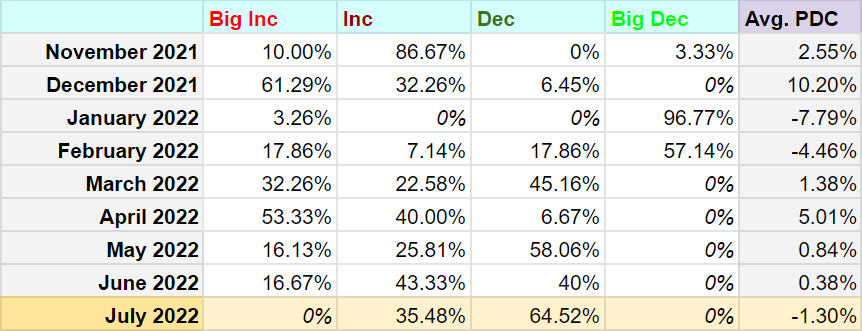
Analysis & Perspective
TL;DR: Optimistically, July looks like it could be a turning point from NYC’s Spring/Summer surge & plateau. We’ve started to see a turn where decreasing days greatly outnumber increasing days, and the average PDC has shifted negative for the first time since February.
The average PDC for July 2022 is now trending slightly negative at -1.30%. While it may sound counterintuitive that many of the wastewater load metrics were higher in July than June, this indicates July may have contained a peak, with the trend shifting to a decrease. Outside of wastewater, this can give hope that August’s decreasing caseload in NYC represents a true decline in the virus for the city, not just a decrease due to lower testing.
Though we haven’t yet seen a strong “big decrease” of PDC under -5% that has indicated the end of previous surges, we may at least be exiting the relatively stable situations of May and June (with an avg. PDC of +0.84% and +0.38% relatively, and are definitely far from the initial surge of April that had an avg. PDC of +5.01%.
Closing thoughts
Overall, July’s data shows a continuation of June’s relatively high concentrations of COVID (roughly comparable to the peaks of the Winter 20/21 and Delta surges), but suggests the city may be hitting a turning point in the current wave. I’ll be eagerly awaiting the wastewater data from August to hope it’s good news.
Before parting, I’d love to hear from you in the comments below if this was useful. Oh and also, if anyone has contacts at the NYC Dept. of Sanitation or NYC Dept. of Health & Mental Hygiene, I’d love to contribute whatever I can to an effort to set up a daily dashboard of wastewater concentrations! Let’s make it happen!
Some good news
Unrelated to wastewater, I’m going to try closing these newsletters with a roundup of recent COVID-related news on the bright side of things - reasons to be hopeful about our ability to navigate out of this pandemic.
NYT: Biden Administration Plans for New Booster Campaign Soon After Labor Day - The government is getting ready to roll out boosters that provide more robust protections against newer variants/mutations, including omicron subvariants.
In the field of new approaches: Nasal vaccines for COVID-19 could potentially completely inhibit infection, abolish community spread, and prevent the emergence of new variants. More than a dozen are now being tested, and The New Scientist notes that they are “Commercially High Risk, Perhaps High Reward.”
And lastly, in terms of preventing some of the worst non-lethal consequences of infection: Findings of unique tissue inflammation responses from COVID could offer new pathways for future preventative & therapeutic Long Covid research
That’s all for this month — thanks for reading and consider sharing if you found this helpful!
If we had *daily* wastewater metrics, that would be a different story. Not only could those paint a picture of what’s happening in the city in real-time, they could even show surges before they appeared in official cases data! But that’s a discussion for a different post.