


August 2022: COVID in NYC Wastewater
Three possible predictions for NYC's wobbly post-summer decline


Welcome back to the Deep
About a week ago, NYC updated its COVID wastewater tracking with data for August, so it’s time for another look at what our sewers are saying about the pandemic.
Thanks to everyone who read & subscribed last month. I’m still experimenting with the right balance of technical details & high-level takeaways — so this month, I’m starting with headlines, then working backwards to explain how I got there:
TL;DR: On one hand, NYC’s COVID in wastewater was lower in August than it was in July! That’s good news! But also, that decline may be slowing down — and that’s not good!
Two stories in the wastewater: The Good News
To get started, I should keep myself honest — how good were the predictions last month? In the previous update, I wrote “the city may be hitting a turning point in the current wave.” Fortunately, August’s numbers do indeed show a decline in COVID wastewater concentrations.
Here’s a graph of the estimated COVID wastewater load (in purple)1. August 1st is marked by the vertical blue line (July is the grey vertical line):

And here’s a close-up of the last 6 months:

The key callout: the mean COVID concentration in wastewater in August (blue dotted line) is meaningfully lower than the mean concentration in July (grey dotted line).
In fact, this is the first month since February 2022 that that mean COVID concentration has decreased:

Across all 4 of the metrics tracked above, we’re seeing declines, with some of the best numbers since April. After a long plateau (at levels comparable to the peak of the Delta surge of mid-2021 or “Second wave” in Winter 2020/21), August shows a decline from the peak — possibly indicating the current wave reversed in July and has started to wane.
Certainly, something to celebrate. But there’s also data that gives me pause.
Two stories in the wastewater: The Cautionary News
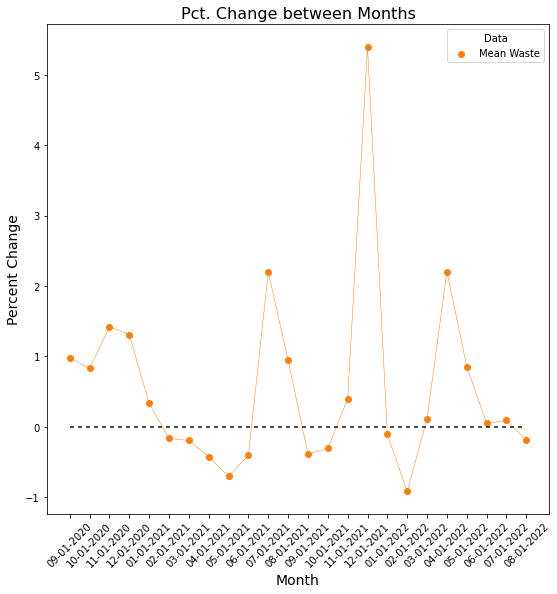
Last month, I shared a metric for Percentage Daily Change: on a given day, did the concentration of COVID in wastewater appear to be rising or falling since a week-and-a-half ago? 2
When a month has mostly days that COVID in wastewater is rising, the situation is getting worse. When there are mostly days where it’s falling, things are getting better. Previous waves & surges have generally ended with many days falling “a lot” (-5% or more).
July had a 2:1 ratio of falling-to-rising days (leading to my prediction it might be a turning point). That 2:1 ratio of falling-to-rising days was roughly the same for August as well:


That’s certainly not bad news.
What I’d label concerning news is that the ratio hasn’t improved — and in fact, the average PDC got worse (-0.16% in August compared to -1.30% in July). PDC isn’t a perfect one-to-one reflection to the path of COVID concentrations, but it is an indicator of its general behavior.
This may portend some not-great news: that concentrations have fallen, but could be hitting a new plateau around 7.75 million copies.
In fact, there’s more evidence for this - Biobot’s wastewater tracking shows wastewater concentrations currently rising on a national & regional level.
This could place the end of our surge much farther out.
What does it mean to “exit a surge” anyway?
I kept writing that wastewater numbers in NYC indicate we’re “in a surge.” Eventually, I hope I write that we’re out of a surge, but since this is a data newsletter I’d like to quantify that a little bit more.
Looking at the history of COVID wastewater in NYC, there are several periods between waves where concentrations bottom out:

These periods roughly have maximum concentrations ~2 million copies, and the entire periods have means around ~1 million copies.
To be generous then, I’ll say that based on wastewater, NYC is in a surge when concentrations are above 2 million copies for more than a week, and that we’re out of a surge when concentrations are under 2 million copies for more than a week.
Perhaps we could also then say that NYC is in an ideal COVID maintenance state when we are under 1 million copies for more than a week (during these periods, we have even seen minimums around ~500K copies). For what it’s worth, the last time we saw this “ideal” state was about 6 months ago, in early March 2022.
So what might the future hold?
Of course, data is not destiny. We can really only learn about the past (especially due to the delays in wastewater data reporting). Any combination of the updated booster shots, return to classrooms, transit mask updates, or dozens of other factors could change directions. Complex systems are stupendously unpredictable.
I think there are three hypothetical predictions one could make looking at August’s data:
OPTIMISTIC: Good things are coming! Concentrations of COVID in wastewater will soon plummet! In this prediction, next month we’d see wastewater concentrations drop by an even larger percentage, showing a true end to the current surge. This position isn’t without evidence: since the last day of wastewater data, 7 day average cases data in NYC have declined from 2,368 to 1,815 (23%). Though cases and wastewater aren’t 1:1, this certainly could be a good sign.

BOTH OPTIMISTIC & PESSIMISTIC: We are entering a period of decline, but it will take many months to fully exit the surge. In this prediction, COVID decreases in a pattern more similar to the end of the Winter 2021 surge than the Omicron surge. In the latter instance, cases dramatically fell in less than 2 months. In the former, the decline took over 4 months:
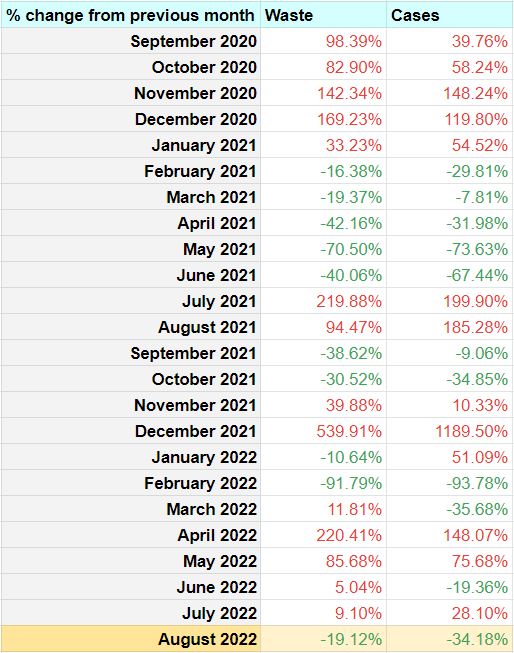
The most recent month-over-month change is about -19%. Ideally, we’d want to see that decline accelerate (as it did in April 2021 from -19% to -42%; or February 2022 from -10% to -91%).
From the looks of the data, the decline doesn’t seem to be accelerating. And at a -20% month-over-month change, it will take 6 months for levels to drop from 7.7 million to 2 million - or until February 2023. While better than another surge, this is a long path out.PESSIMISTIC: August was a good month, but isn’t a trend. We’ll see concentrations stabilize or increase. With this prediction, we’d expect to see concentrations remain around 7.5 million copies in September, like they were in August. As previously mentioned, there’s some evidence for this path in Biobot’s wastewater data for the Northeast region. The NYC cases data mentioned above, cases seem to have stalled out around a 7 day average of 1,800 for the past week and a half. In the worst-case scenario, we’d actually see these numbers increase from August’s average, indicating that the 2022 Summer surge is living on for many more months.


For what it’s worth, I’ll personally bet on Prediction #2 (slow and gradual decline) — a repeat of Winter 2021. I’ll check in on the numbers when September’s COVID wastewater data gets released — and cross my fingers that I’m proven pessimistic.
Some good news
Unrelated to wastewater, here’s some recent COVID-related news that gives reasons to be hopeful about our ability to navigate out of this pandemic:
First nasal vaccine approved for use in India. As mentioned previously, nasal vaccines have the potential to not only reach resource-limited communities, but “break the cycle of transmission” that leads to new COVID variants emerging.
New research initiative on Long COVID launches. Long COVID has been one of the biggest lingering dangers of the pandemic, but has been vastly under-studied relative to its impact. Research on prevention & treatment could blunt some of the pandemic’s major lingering risks.
mRNA vaccines are just getting started. We’re still learning everything that’s possible with the breakthrough technology powering COVID vaccines, and scientists are already experimenting with shots that produce more antibodies with fewer side effects.
And finally…
If you haven’t heard, updated COVID booster shots are here! These new shots provide more robust protection against recent variants, and are available to all New Yorkers. Schedule a NYC appointment here, or through your local pharmacy.
Let’s keep NYC healthy!
Read more about this metric in last month’s update.
Read more about this metric in last month’s update.